playing with labeled cells, embed, figure ...
trying with cells that produce:
a 2d plot
a pandas df
a folium map
matplotlib output
import numpy as np
import matplotlib.pyplot as plt
the source cell
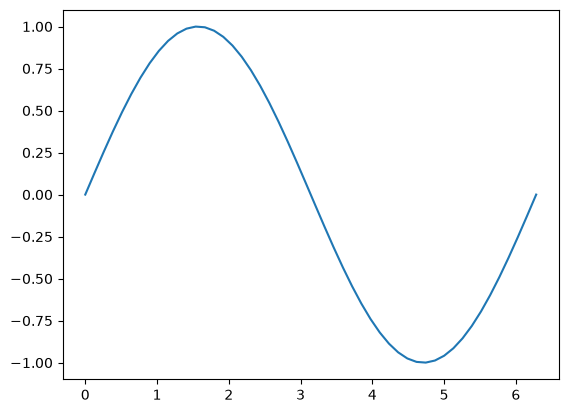
we put a label the-labeled-plot on the following code cell
X = np.linspace(0, 2*np.pi)
Y = np.sin(X)

plt.figure()
plt.plot(X, Y);
The history saving thread hit an unexpected error (OperationalError('attempt to write a readonly database')).History will not be written to the database.
referencing the-labeled-plot
WITHOUT -- the exclamation mark
we write this
[some visible text](#the-labeled-plot)
some visible text
WITH -- an exclamation mark
we write this
 (text in brackets doesn’t seem to be used)
matplotlib output
EMBED instead
now we use an embed directive - with a sharp # in front of the label
matplotlib output
FIGURE instead
now we use an figure directive - same thing, with a sharp # in front of the label
matplotlib output
some figure text goes here
pandas df
import seaborn as snstitanic = sns.load_dataset("titanic")
titanic.head(2)Loading...
hover on this text to view the dataframe
folium output
import foliumthe source cell
we put a label the-labeled-map on the following code cell
CENTER = 48.856542, 2.347614

# prune-cell

# on purpose a little smaller so we can more easily scroll
def paris_map():
    return folium.Map(
        location=CENTER,
        zoom_start=13,
        # width='80%',
    )

paris_map()
Loading...